KASAN - Kernel Address Sanitizer
— lkmp, linux, kernel — 8 min read
Kon'nichiwa peeps!
Today, we'll be learning about a very interesting topic called as CONFIG_KASAN. This is going to be a looonggg post - So buckle your seatbelts 😺
The reference for the below post is from this awesome talk by Dmitry Vyukov called as Dynamic Program Analysis for Fun and Profit and the slides for the talk are here.
Note: For those interested there's are plethora of interesting talks at LF Live: Mentorship Sessions.
Brief Overview
What is CONFIG_KASAN?
KASAN stands for (Kernel Address Sanitizer). This is a dynamic program analysis tools specifically designed to detect/catch memory safety errors/bugs such as out-of-bounds and use-after-free.
KASAN is enabled with the CONFIG_KASAN configuration option when building the kernel.
Currently we have three KASAN modes (More explanation about these in Detailed Summary section below):
- Generic KASAN - Large memory overhead - MAINLY for debugging
- Software tag-based KASAN - Less memory overhead - Used for Real work loads and dogfood testing (testing on your own software in production/real world)
- Hardware tag-based KASAN - Low memory and performance overhead - Can be used either as an in-field memory bug detector or as a security mitigation.
Usage/Config Options
KASAN can be enabled using CONFIG_KASAN=y in your configuration file while
building Linux Kernel. Once that is enabled you could choose between the
following options.
CONFIG_KASAN_GENERIC
Use this to enable generic KASAN
CONFIG_KASAN_SW_TAGS
Use this to enable software tag-based KASAN.
CONFIG_KASAN_OUTLINE & CONFIG_KASAN_INLINE
For the above two software modes (Generic KASAN and Software tag-based KASAN), you also can configure the above two options.
Outline and Inline are compiler instrumentation types. Compiler instrumentation is used to insert tag checks.
CONFIG_KASAN_OUTLINE: The memory checks are made by callbacks. i.e Before every memory access compiler insert function call asan_load*/asan_store*. When a tag mismatch is detected in this mode, KASAN simply prints a bug report.
CONFIG_KASAN_INLINE: The memory checks are made inline. i.e Compiler directly inserts code checking shadow memory before memory accesses. When a tag mismatch is detected in this mode, clang inserts a brk instruction and KASAN has its own brk handler, which reports the bug.
The difference between the above two is that outlining produces a smaller binary at the cost of run-time overheads from calling functions, whereas inline produces a large binary since it directly adds code to it but it is 1.1 -2 times faster
CONFIG_KASAN_HW_TAGS
Use this to enable hardware tag-based KASAN
CONFIG_STACKTRACE
Use this option to include allocated and free stack trace of affected slab objects into reports. Slab objects is a contiguous piece of memory made of several physically contiguous pages.
Refer for more details: https://hammertux.github.io/slab-allocator
CONFIG_PAGE OWNER
Use this option to include allocated and free stack traces of affected physical
pages. To use this option you need to boot the kernel with page_owner=on
Additional Boot Parameters
KASAN can be easily customized using various command line parameters. By
default, KASAN does not panic the kernel after printing a bug, you can do so by
using the panic_on_warn parameter.
Similarly you could use kasan_multi_short to print a report on ever invalid
memory access thus overriding the default behaviour where KASAN prints a bug
report only for the first invalid memory access.
Hardware tag-based KASAN also has/supports boot parameters.They can be found at: https://github.com/torvalds/linux/blob/master/Documentation/dev-tools/kasan.rst#boot-parameters
Detailed Summary
Yaay! This is where the fun begins :D
Types of Program Analysis
There are two types of program analysis:
Dynamic - In this we analyze the properties/characteristics of a running program. These properties hold on a single execution. That means, For the same code when the program is run, the result of dynamic analysis can differ (Eg: Memory location etc.)
Static - In this we analyze the properties of program code. These properties hold on all execution. I.e the results differ only when we change something in the code
In simpler words, Dynamic program analysis means to analyze a program when it is executing whereas, Static program analysis means to analyze the program when it is not executed.
Static Analysis tend to produce lesser true positives and more false positives simply because it does not have the information of the actual state the program might be when it’s run. Whereas, Dynamic analysis is cost effective way of discovering bugs.
For eg:
1void func() {2 char* p = malloc(10);3 p[20] = 1; // OOB (out-of-bounds)4}Static analysis can figure out there is an OOB error in the above code because
it’s very simple. We could take note of the size allocated to the p pointer
when we are analysis the code and then wherever p is used we can compare the
noted size against all subsequent access to that array/buffer.
But if we have the following:
1void func(int index) {2 char* p = malloc(10);3 p[index] = 1; // OOB?4}Static analysis cannot catch the bug here, only because it does not even know
the value of index. Just by making index as a variables - things have gotten
more complicated. Because we cannot make any assumptions as to how the index
might be computed and this computation can happen anywhere in the source code.
But Dynamic analysis can catch an OOB because we do these check during the runtime of the program. It’s pretty easy for Dynamic analysis because we could memorize the size of the heap block when it was first allocated, and then whenever the heap block is accessed we can compare the index with the block size and report an OOB (out-of-bounds) bug.
To Summarize
Static analysis can find simple and more local bugs. It would have more code coverage and faster feedback.
Dynamic analysis finds more complex bugs, no false positives and a simpler usage model.
It should be noted that, I did not make the above comparison to say the one is better than the other. Rather my only objective here is to say that the above two methods have their own use cases.
How does KASAN work internally
Note: The images for the following explanation have been taken from the slides Dynamic Program Analysis for Fun and Profit
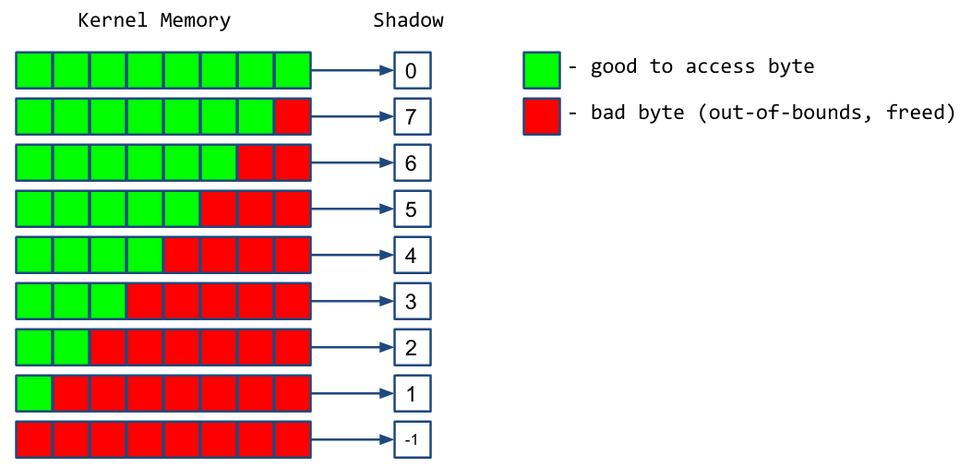
KASAN assigns a shadow bit for each byte of data. The shadow bit represents if that byte is corrupted or not.

The values in the shadow bit will range from ( -1 <= 0 <= 8 ).
Values of the shadow bit:
- Zero (0) - Means that the byte is good to access. Good to access means that the memory is well within bounds and it’s not freed.
- Negative 1 (-1) - The byte is corrupted
- Integer N, If the value of the shadow bit is an integer other than 0 or -1, then
it means only
Nbits of the byte are good.

KASAN takes around 16TB of virtual memory. And the mapping between kernel memory stuff and Shadow block happens using the following formula:
1Shadow bit = Address/8 + offsetThe code snippet might look like:
1static inline void *kasan_mem_to_shadow(const void *addr)2{3 return (void *)((unsigned long)addr >> KASAN_SHADOW_SCALE_SHIFT)4 + KASAN_SHADOW_OFFSET;5}The KASAN_SHADOW_SCALE_SHIFT is 3.
The above formula means that the address of any variable is right shifted by 3 that means the address is divided by 8 and an offset is added.
For eg:
If we want to write an address p_addr
1long *p_addr = 1; // 8 bytesThen the compiler adds a check before the execution starts:
1// shadow = kasan_mem_to_shadow(p_addr)2shadow = p_addr >> 3 + 0xdffffc0000000000;3if (*shadow)4 kasan_report8(p_addr);5*p_addr = 1; // 8 bytesThis way, we now have a mechanism to ensure that only good memory locations are accessed.
Strategies used by KASAN to detect errors and report them
OOB Error - Red Zone around heap objects
We have seen earlier that an out-of-bound error happens when we try to access memory that is not allocated to the heap object, stack, global variable etc. And this is possible because the heap objects are allocated next to each other.
But KASAN inserts Red Zones between the heap objects.

The shadow-bit for the above red-blocks of the memory are marked as bad. And if kernel tries to access it, KASAN throws an error. This way, you are not accessing the heap object you are not concerned with.
To summarize, KASAN adds red-zones between heap objects (this is possible, because KASAN marks the shadow bit for those red-zones as not accessible) and hence when we try to access a memory that’s out-of-bounds, we’ll likely step into red-zone and be alerted.
UAF Error - Quarantine for heap objects
Note: The images for the following explanation have been taken from the Linux kernel heap quarantine versus use-after-free exploits
A use-after-free happens due to the incorrect use of dynamic memory during the program operation. If after freeing a memory location a program does not clear the pointer to that memory an attacker can use that to hack the system.
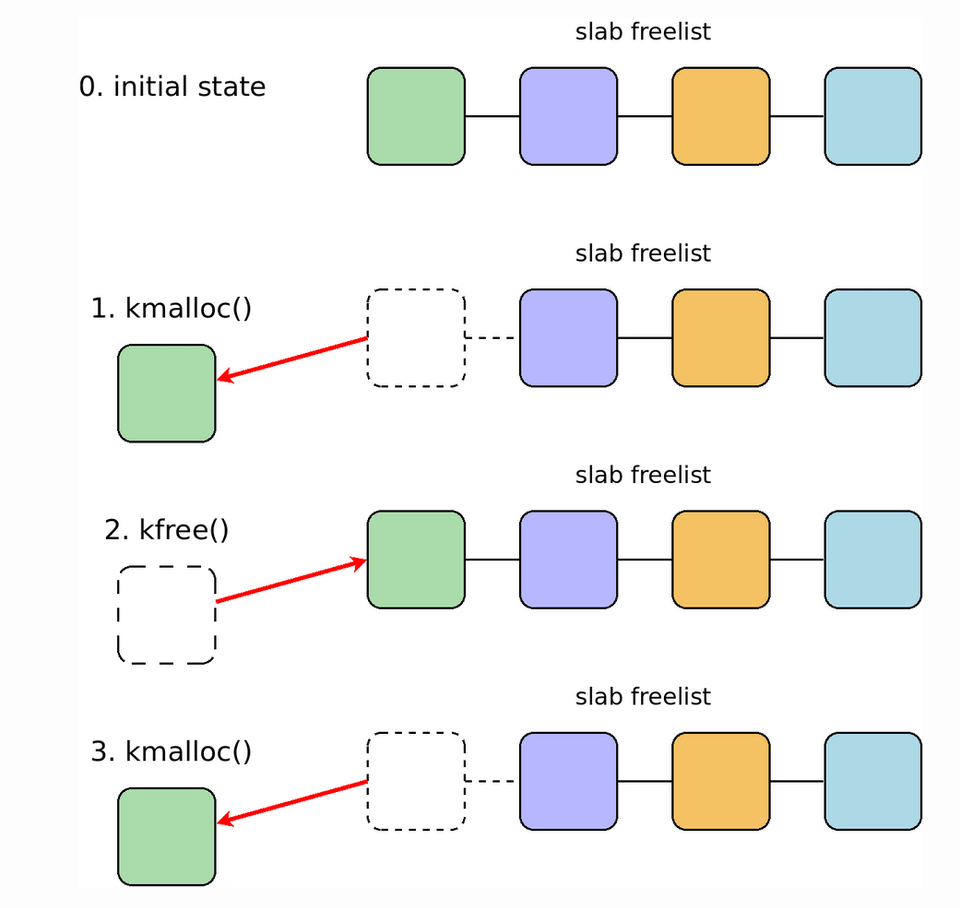
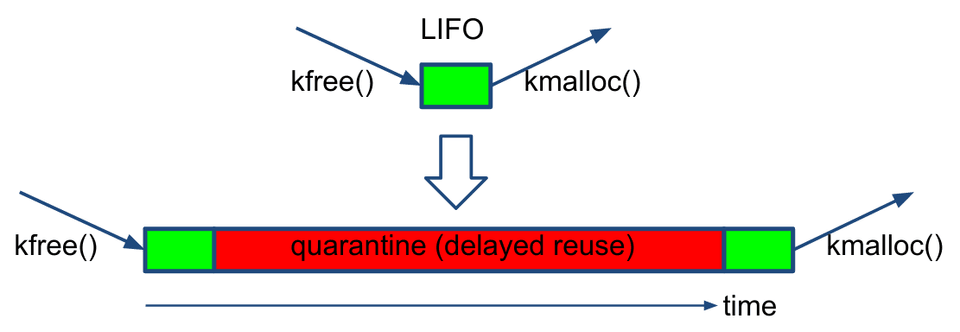
When we free a heap object without KASAN, it will be reduced in LIFO (Last-in-First-Out) manner, so that the next kmalloc call of the same size will most likely return the same object which was freed.
Why is the above way bad? Let's take a look.

To understand the above image, let’s take a very simple example. I have the following pseduocode:
1struct auth {2 int flag;3 char[10] name;4}5
6
7// A struct of same size as above8struct service{9 int logged_in,10char[10] service_name;11}12
13// A pointer to the above auth struct14struct auth_ptr *auth;15
16// A pointer to the service struct. It has the same size as of auth struct17struct service_ptr *service;18
19// Allocate memory to auth20// Equivalent to State 1 of the above diagram21auth_ptr = kmalloc (auth);22
23// Free the auth object24// Equivalent to State 2 of the above diagram25kfree(auth_ptr);26
27// Since the size of service is same as that of auth struct, the 28// memory which was recently freed by auth will be allocated to 29// service. 30// Equivalent to State 3 of the above diagram31service_ptr = kmalloc(service);32service.logged_in = 1;33
34
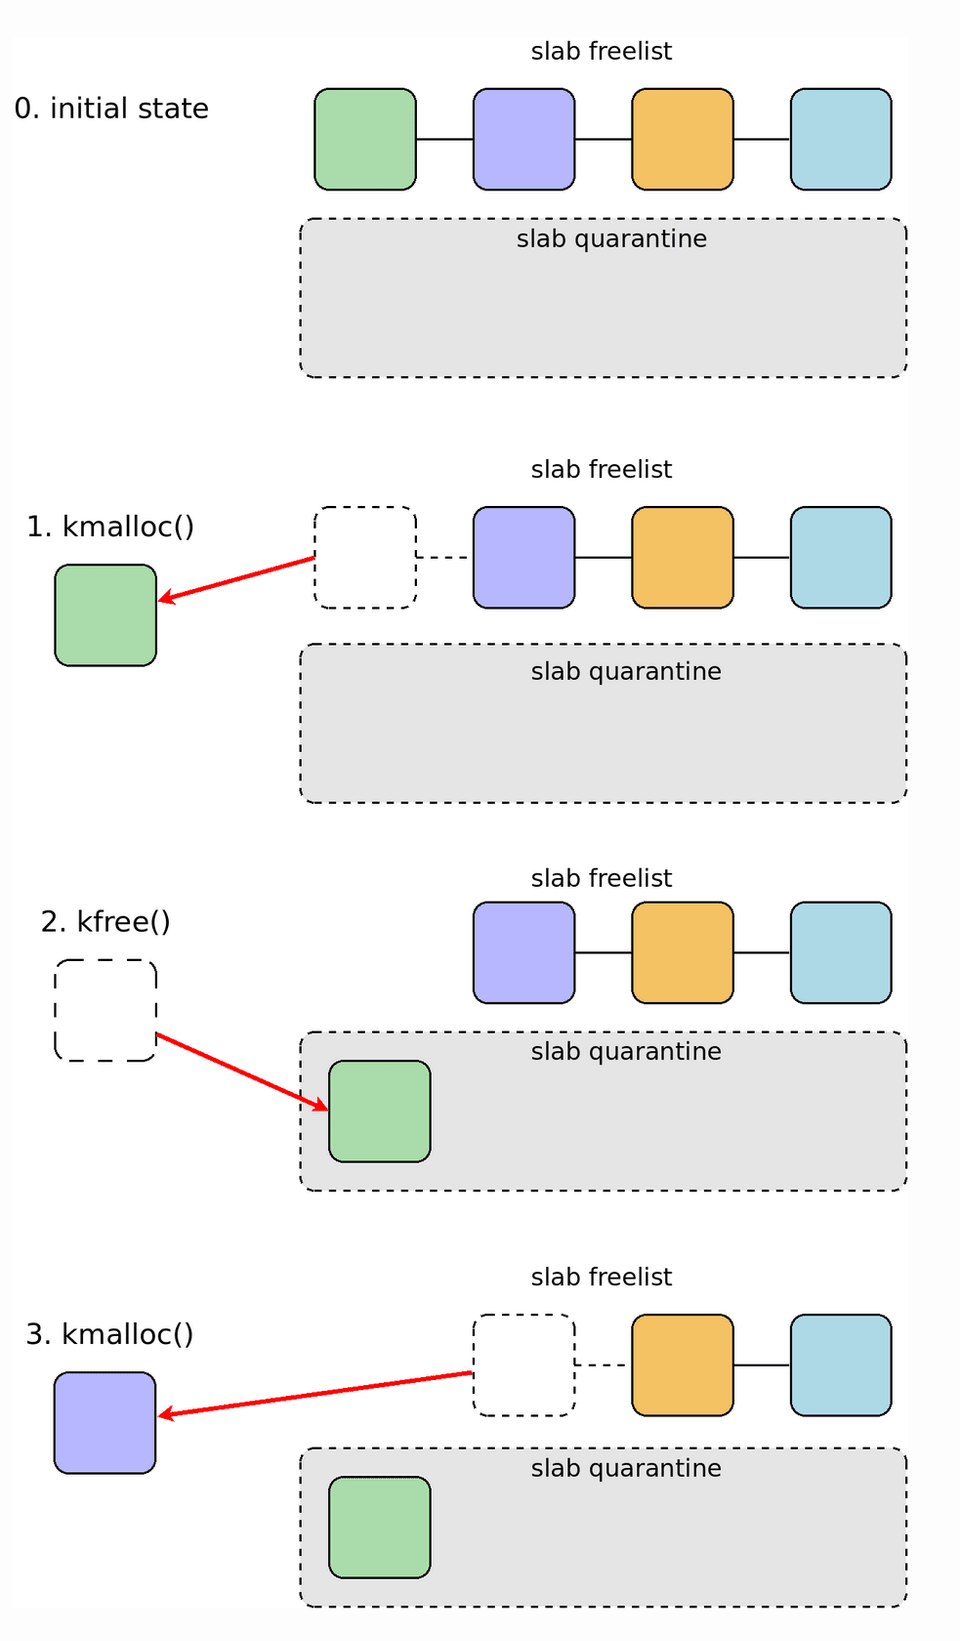
35// This is where the UAF happens. We are using `auth` after it has been36// freed37// This block of code still executes, because `auth` still has access to38// the memory block that is assigned to service. And since the value39// of logged_in was set to `1` and since both `service` and `auth` have 40// the same size. The value of `auth->flag` will also be 1.41// 42if (auth->flag == 1) {43 login()44}To avoid the above case to happen, KASAN uses the concept of Quarantine for heap objects. As shown below.


A
To summarize:
KASAN puts the recently freed memory object into Quarantine which delays the reuse of the heap objects. And when the heap object is put into quarantine, the shadow for that memory is marked as BAD, and if Kernel tries to access this block during Quarantine the KASAN can detect it and throw errors.
NOTE: The above method is only available in GENERIC_KASAN mode.
Memory Tagging / Software-Tag-Based KASAN
Note: Reference for the following has been taken from https://lwn.net/Articles/766768/
Generic KASAN usually takes up a lot of memory and has slow performance and hence can only be used for debugging. In-order to be able to use software based KASAN in production level systems, a new method was developed based on memory tagging.
Memory tagging (aka memory coloring) is a mechanism to track illegal memory operations such as buffer overflows, and use-after-free errors.
The new mode uses a different approach that takes advantage of an ARM64 feature called top-byte ignore (TBI). The 64-bit pointer allows for a large address space. In TBI, when it is enabled - the top byte of the address is used to store 8 bits of arbitrary information. One use for this is that, we could now use that byte to ensure that the pointers into memory are pointing to where they were actually supposed to. We can call this 8bit/the top byte as a tag.
In the software-tag-based mode, we still use the shadow byte. Ie. KASAN still creates a memory map between the shadows and the actual memory location. But now byte in the map now corresponds to 16 bytes of real memory rather than eight, cutting the size of the map in half.
In this, whenever the kernel allocates any new memory, a random eight-bit tag value will be chosen. This tag-value is stored both in the shadow memory and the top byte of the pointer that is returned when the memory is allocated. And similar to GENERIC KASAN, the compiler inserts checks before each memory access to ensure that the two memory tags match. In case of a tag mismatch, software tag-based KASAN prints a bug report.
This method is much more faster, since the memory has been cut into half and with the usage of tags, you can check more memory. In the GENERIC KASAN, you were able to catch references to the memory that kernel is not meant to access, but with the tags, you can compare more than that. I.e we can catch the use of pointers that have strayed into the wrong part of kernel.
Hardware-Tag-Based KASAN
Hardware tag-based KASAN is similar to the software mode, but instead of relying on compiler instrumentation and shadow memory, hardware memory tagging support is used.
Conclusion
The above summary is not the entire description of how KASAN works. I’m sure that there is a lot more details and information regarding KASAN. But as of yet, with my current level of knowledge - I was only able to comprehend the above stuff. But I am sure as time progresses and I keep taking one step at a time, Some day I’ll be able to comprehend everything :)
Also I am sure I might have made some mistake in my understanding, I apologize for that and I would be really happy for the feedback so that I can rectify them and learn about them better ^^